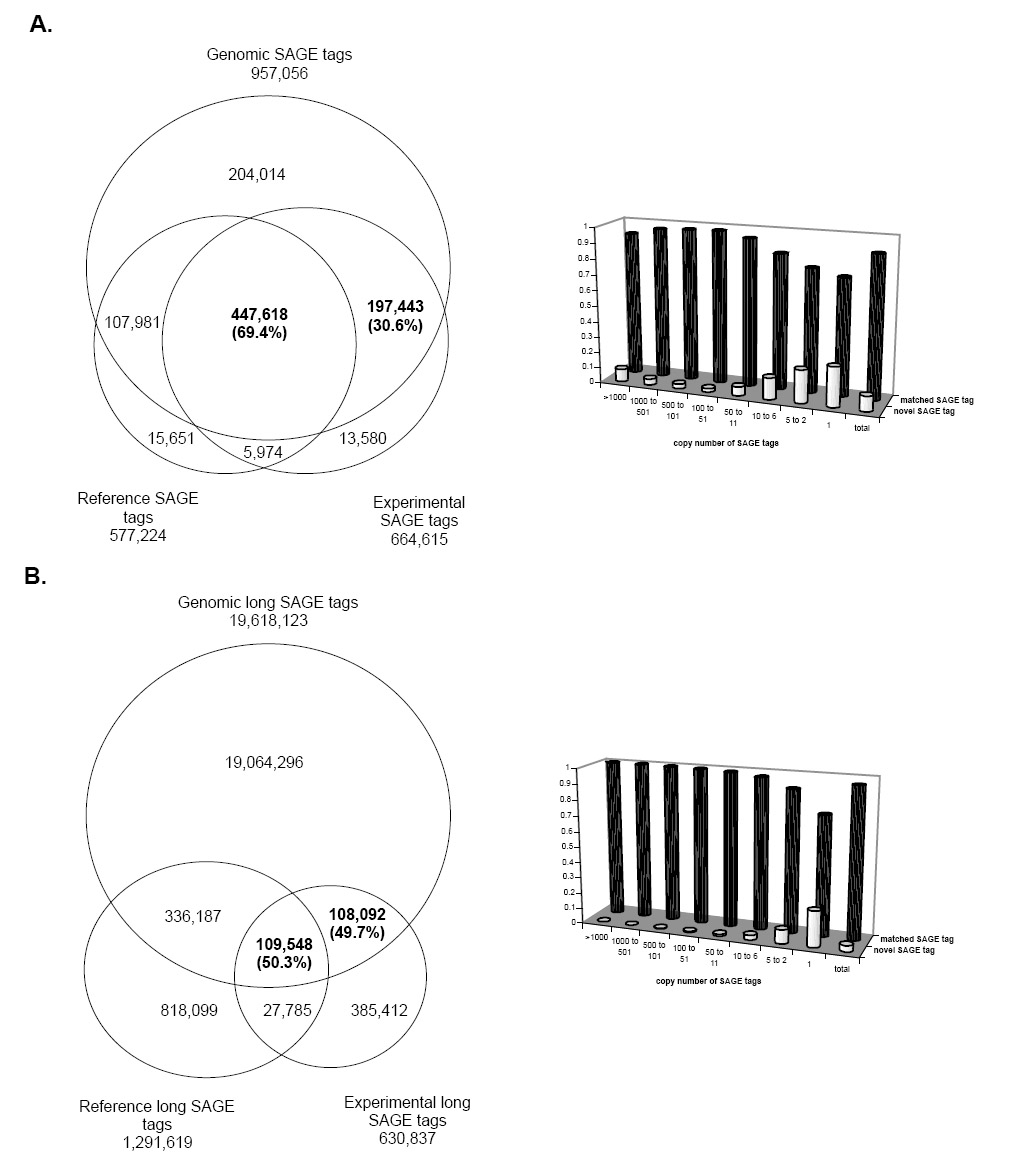
Fig. 1.

The comparison between SAGE tags, reference SAGE tags of known human transcripts and genomic tags of the human genome sequences. Figure 1A shows the analysis of the standard 10-bp tags. Figure 1B shows the analysis of the 17-bp long tags. Of the experimentally collected SAGE tags that mapped to the genome, 30.6% of the 10-base tags and 49.7% of the 17-base tags have no match to the corresponding reference SAGE tags. The histograms show the copy number distribution of the matched SAGE tags and the novel SAGE tags in their original SAGE libraries. In both types of SAGE tags, the novel SAGE tags have lower copies than the matched SAGE tags.
