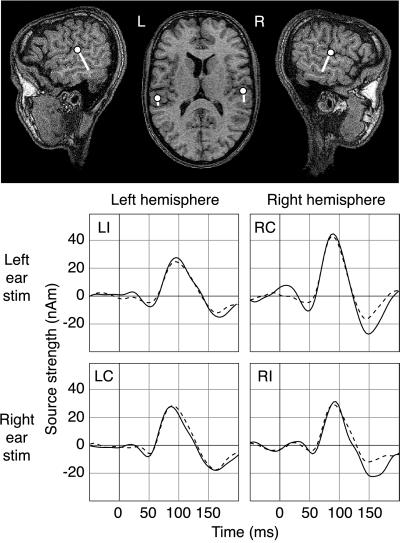
Figure 1.
Cortical areas activated by tones and their activation strengths as a function of time in one male Finnish subject. (Upper) The center of the active area (dot) and the direction of current flow (tail) superimposed on the subject’s MR image. (Lower) Time course of activation of the left (Left) and right auditory cortex (Right) to stimulation of the left (Upper) and right ear (Lower), when the subject was reading (solid line) or studying pictures (dashed line). The source strengths are expressed in nanoamperemeters. LI and LC indicate left-hemisphere responses to stimulation of the ipsi- (left) and contralateral (right) ear, respectively. RI and RC denote the right-hemisphere responses.

