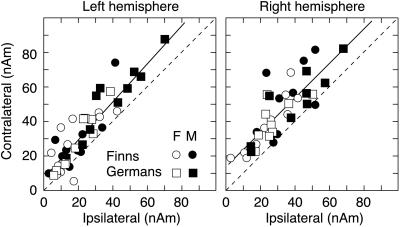
Figure 3.
Source strength of the N100m contralateral to stimulation as a function of the ipsilateral N100m response in all subjects, plotted separately for the left and right hemispheres. The coding of the four groups is given on the figure (F, female; M, male). Linear regression to the data points is depicted with solid lines (see text for details). Dashed lines indicate where contra- and ipsilateral responses would be equally strong. Clustering of symbols above this diagonal indicates that contralateral N100m exceeds the ipsilateral N100m.

