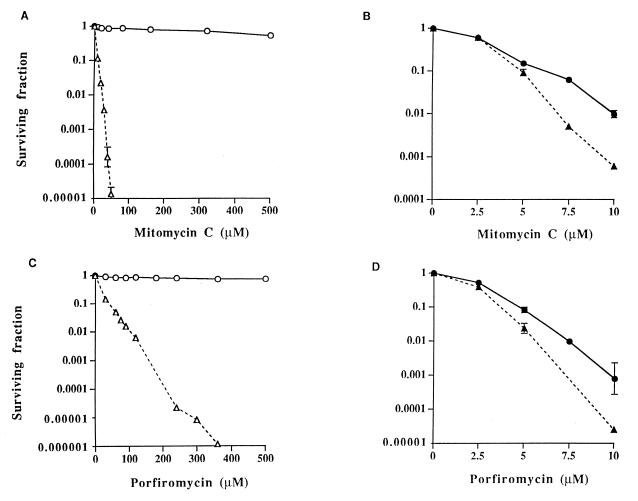
Figure 3.
Survival curves for CHO-K1/dhfr− parental and CHO-MCRA-1 cells treated with graded concentrations of mitomycin C or porfiromycin for 1 hour under aerobic (A and C) or hypoxic (B and D) conditions. Survival curves for CHO-MCRA-2 are similar to those for CHO-MCRA-1 and are not shown. Surviving fractions were calculated by using the plating efficiencies of the aerobic and hypoxic vehicle-treated controls. Points are geometric means of survivals from 3 to 8 independent experiments; SEMs are shown where larger than the points. ○, ● (solid line), CHO-MCRA-1 cells; ▵, ▴ (dashed line), CHO-K1/dhfr− parental cells. Note differences in scale for surviving fraction and drug concentration under the different conditions of oxygenation.

