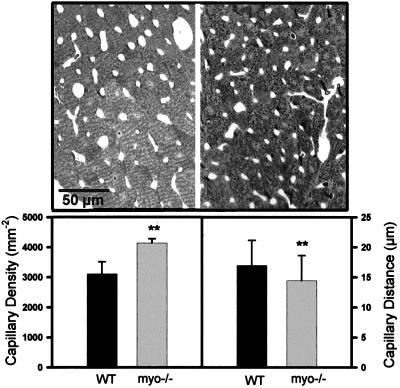
Figure 5.
Analysis of capillary densities in WT and myo−/− hearts. Representative micrographs for WT (left) and myo−/− hearts (right) are shown together with the quantitative data for capillary density and capillary distance. Bars represent means ± SD for 6 WT (black bars) and 6 myo−/− hearts (gray bars). ∗∗, statistically significant (P < 0.01).

