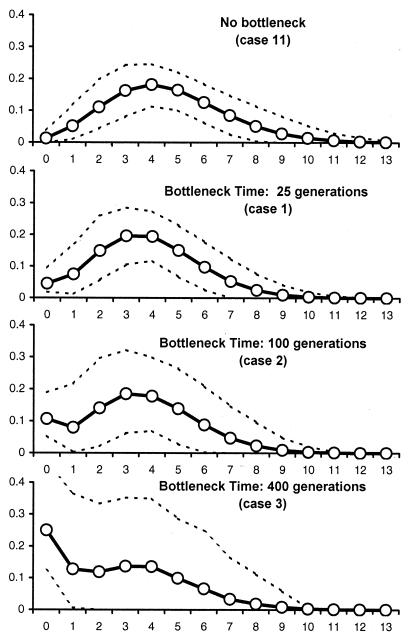
Figure 2.
Average distributions of the number of pairwise differences in simulated populations after a large stepwise demographic expansion 2,000 generations ago and a recent bottleneck. The number of pairwise differences are on the x axis, and their frequencies are on the y axis. The case numbers correspond to those described in Table 2. The dashed lines delimit a region incorporating 90% of the simulated points.

