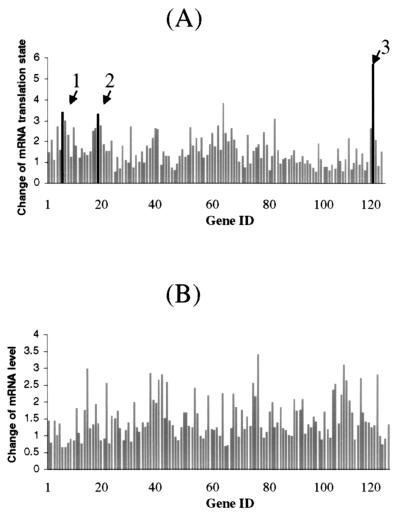
Figure 3.
Comparing translation states (A) and relative levels (B) of mRNAs in growth-arrested and serum-activated human fibroblasts. The hybridization signal of each element on the human cancer cDNA expression array was quantified and normalized to the median value of all the elements on the filter. A subset of genes was selected for graphing according to the following selection criteria: (i) specific hybridization signals were found on all four human cancer expression array filters and (ii) hybridization signals were consistent among the duplicates of the particular gene. (A) The translation state of a particular gene was expressed as the ratio of the normalized hybridization signal intensities between the well-translated and under-translated RNA fractions. The change of mRNA translation state was defined in the legend to Fig. 1. The arrows indicate the genes that were identified as translationally regulated on the human DNA array and confirmed on the polysome display and Northern blot analysis in this study: 1, vimentin; 2, Stat1; and 3, 23-kDa highly basic protein. (B) The relative mRNA level was expressed as the ratio of the normalized total hybridization signal intensities between the serum-activated and growth-arrested cells. The total hybridization signal intensity was the sum of the signal on both translated and under-translated array filters.

