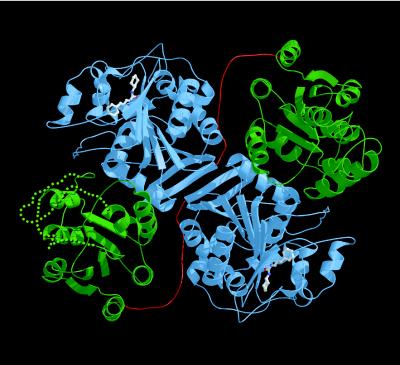
Figure 1.
Ribbon plot of the epoxide hydrolase dimer, color-coded as follows: C-terminal catalytic domain, blue; N-terminal vestigial domain, green; and linker, red. Dotted green lines indicate the disordered Ala-20–Glu-47 and Val-64–Ser-89 segments in monomer A. The location of the active site is indicated by the bound inhibitor CPU. This figure was prepared with bobscript and Raster3D (47–49).

