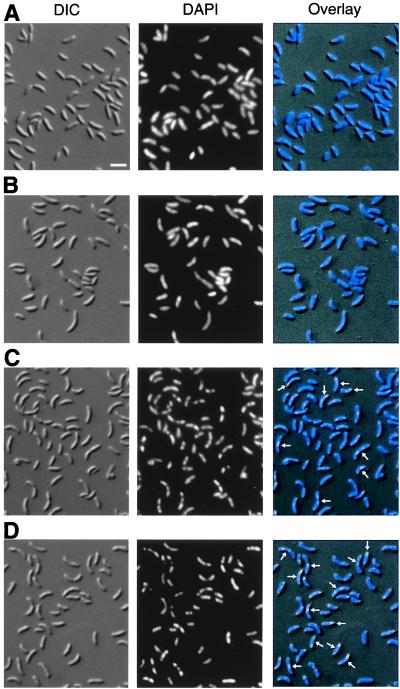
Figure 2.
Nucleoid morphology in wild-type and smc null mutant cells. (A) The parent strain CB15N grown at 20°C. (B) CB15N grown at 20°C and shifted to 30°C for 4 hr. (C) The smc null mutant strain CB15NΔsmc grown at 20°C. (D) CB15NΔsmc grown at 20°C and shifted to 30°C for 4 hr. Nomarski differential interference contrast microscopy images of the cells are shown in the first column, DAPI-stained nucleoids are shown in the second column, and the third column is an overlay of the images. Arrows indicate cells with abnormal nucleoid morphology, and the white scale bar represents 2 μm.

