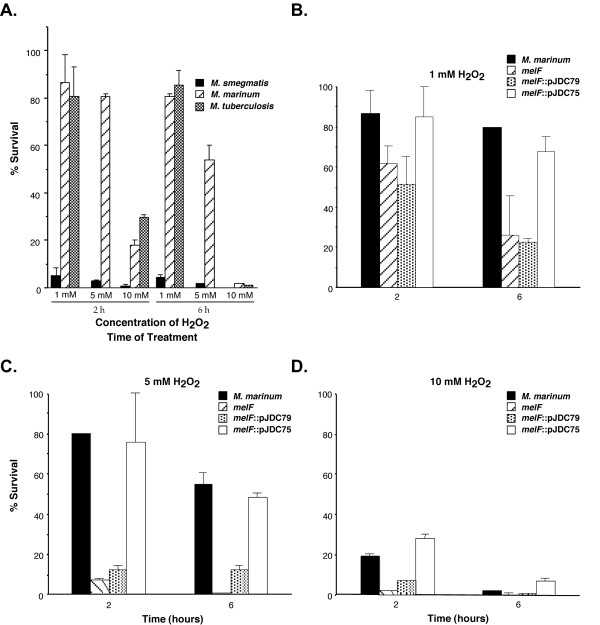
Figure 4.

Susceptibility of mycobacterial species and the mel2 mutant to H2O2. Susceptibility of M. smegmatis, M. marinum and M. tuberculosis to different concentrations of H2O2 for 2 or 6 h (A). The data points are absent for M. tuberculosis at 5 mM H2O2 because these bacteria were only tested at 1 and 10 mM concentrations. Susceptibility of M. marinum wild type as compared to the mel2 mutant that carries an insertion in melF (melF), the mutant carrying a plasmid expressing melF alone (melF::pJDC79) and an integrated single copy plasmid expressing the entire mel2 locus (melF::pJDC75) to 1 mM (B), 5 mM (C) and 10 mM (D) H2O2. The % survival = (CFU Tx/CFU initial) × 100. Data are the means and standard deviations of assays done in triplicate, representative of three experiments.
