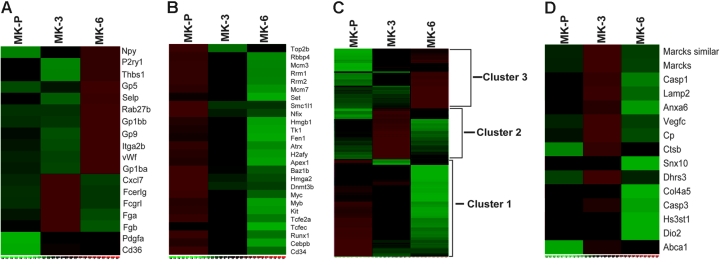
Figure 2.
Gene-expression analysis of MK differentiation. Relative mRNA expression of individual genes (rows) is shown for 3 MK populations (columns) on a scale from low (green) to high (red) levels. (A) Relative expression of known MK/platelet transcripts in the 3 populations, indicating that abundant platelet genes are highly represented in mature MKs compared with MK-P and that some markers are activated earlier than others. (B) Partial representation of transcripts that are highly expressed in MK-P and subsequently extinguished. (C) Hierarchical clustering of the 594 probe sets identified through analysis of variance (ANOVA) in MK populations, revealing clusters that correspond well with successive stages. (D) Of the 32 genes implicated in retinoic acid signaling, 15 are highly expressed in MK-3, which represents a significant overlap (highest GSEA rank in our analysis) and encompasses factors that function in diverse processes.

