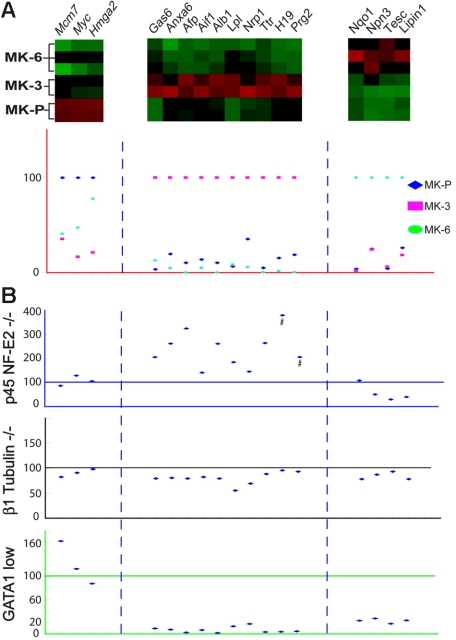
Figure 3.
Molecular markers of MK differentiation stages. (A) Distinctive profiles of putative stage–selective markers revealed in microarray analysis (red = high, green = low levels) and confirmed by qRT-PCR in independent flow-sorted wild-type MK populations. To display the results, peak expression of each marker is represented at 100% in the stage with which it is best associated (although absolute levels of each may differ significantly), and transcript levels in the other 2 populations are expressed in relative terms. (B) Graphic representation of real-time qRT-PCR analysis of candidate molecular markers in unsorted (BSA gradient-purified) MKs derived from mouse models of defective MK differentiation. Individual genes are represented in the same columns throughout the figure and the levels of each are expressed in relation to those observed in wild-type (littermate) MK cultures, which is set at 100%. p45 NF-E2−/− MKs carry higher levels of genes that normally mark MK-3, with minimal change in MK-P markers and reduced levels of MK-6 genes. GATA1lo MKs show significantly reduced expression of genes that normally express well in MK-3 and MK-6, whereas changes in expression of this marker gene panel in β1 tubulin–null MKs are negligible. Error bars are omitted for ease of viewing but are included in Figure S5. #Plotted at one third of actual values to fit the scale.

