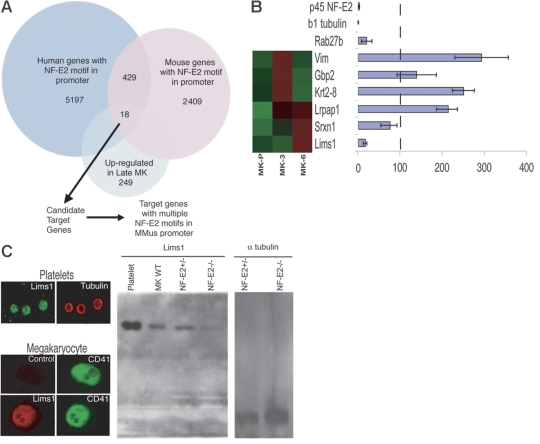
Figure 4.
Identification of candidate NF-E2 transcriptional targets. (A) Outline of the computational approach to identify targets of NF-E2 regulation among transcripts that are significantly enriched in mature MKs. Eighteen genes carried NF-E2 binding sites in their promoters and 6 of these promoters contain 2 or more NF-E2 motifs. (B) Candidate NF-E2 target genes. Microarray results of MK expression are shown on the left (high expression, red; low levels, green) and results of qRT-PCR in p45 NF-E2−/− MKs on the right. For each gene, expression in p45 NF-E2+/− MKs is set to 100% (vertical dashed line) and relative mRNA levels in NF-E2–null MKs are represented in the bar graph. Lims1 mRNA is reduced to levels comparable to those of known NF-E2–dependent genes, Rab27b and β1 tubulin. (C) LIMS1 protein is highly expressed in MKs and blood platelets and levels are reduced in the absence of NF-E2. A representative mature (CD41hi) MK is shown stained for LIMS1. Immunoblot analysis also reveals LIMS1 expression in platelets and MKs, with significantly reduced amounts in p45 NF-E2−/− MKs compared with wild-type (WT) or heterozygous cells. Lanes to the far right represent the loading control (α-tubulin) for heterozygous and nullizygous mutant MKs, respectively. Error bars in (B) represent standard deviation. Images in (C) were captured as described in “Materials and Methods.”

