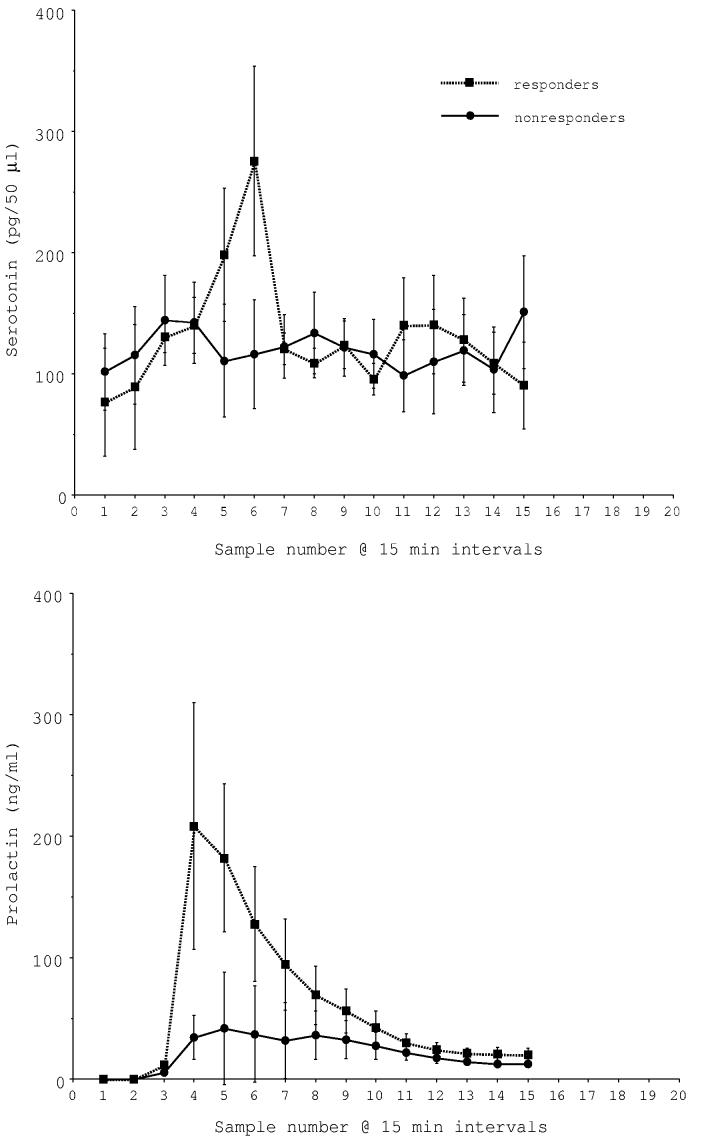
Fig. 1C.

Average serotonin and prolactin concentrations in i.v. fenfluramine responders (n=2) and non-responders (n=3). There was a near significant difference in serotonin between the groups (P < 0.05; 2 way ANOVA) and a highly significant difference in prolactin between the groups (P < 0.0001; 2 way ANOVA).
