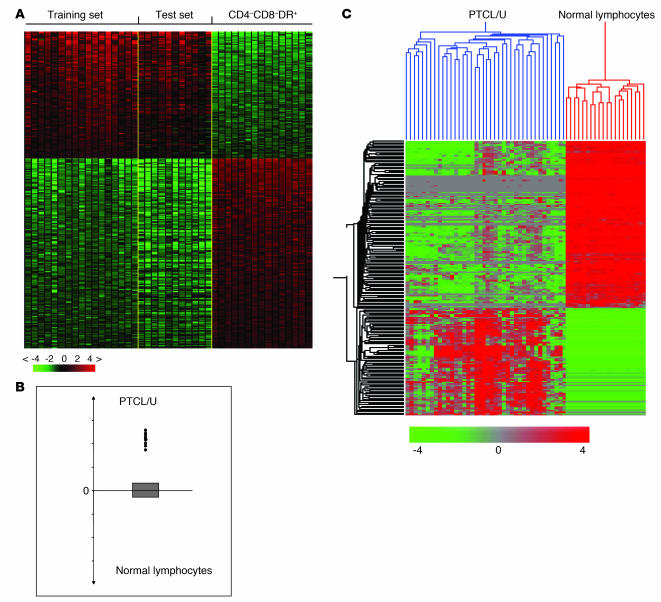
Figure 4. Supervised analysis of PTCL/U and normal lymphocytes identifies differentially expressed genes.
Identification of genes differentially expressed in PTCL/U and normal T lymphocytes. Supervised analysis was performed using 17 samples of PTCL/U (training set) versus the 3 normal T cell subpopulations identified as the closest normal counterparts (CD4+, CD8+, and HLA-DR+). The support value for the analysis was chosen as n = n0 (n0, number of samples in the phenotype set). (A) The analysis identified 155 genes that are differentially expressed in PTCL/U versus all the other samples (Supplemental Tables 5 and 6). The expression of the 155 genes was then investigated and validated in an independent test set (11 PTCL/U cases), represented on the right side of the matrix. (B) A cell-type classification is used to measure the relatedness of test set cases to PTCL/U (training set) and normal T cells. The gray area marks 95% of confidence: the P value decreases with increasing distance from the x axis. (C) In addition, the identified 155 genes correctly classified all the 11 PTCLs/U of the test set in unsupervised analysis.

