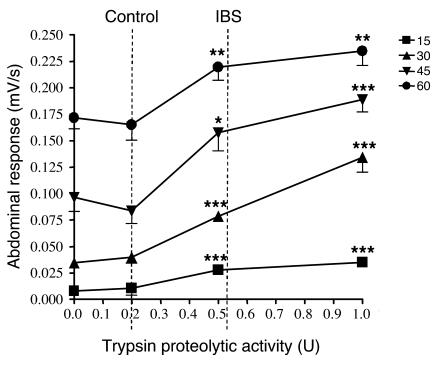
Figure 8. Visceral sensitivity in response to different doses of trypsin.
Abdominal contraction response of mice 6 hours after intracolonic administration of trypsin (0.2, 0.5, and 1.0 U of trypsin) or its vehicle (saline) in response to different pressures of distension (15–60 mmHg). Data are mean ± SEM; n = 8 per dose of trypsin. *P < 0.05, **P < 0.01, ***P < 0.005 compared with control distension (time 0).

