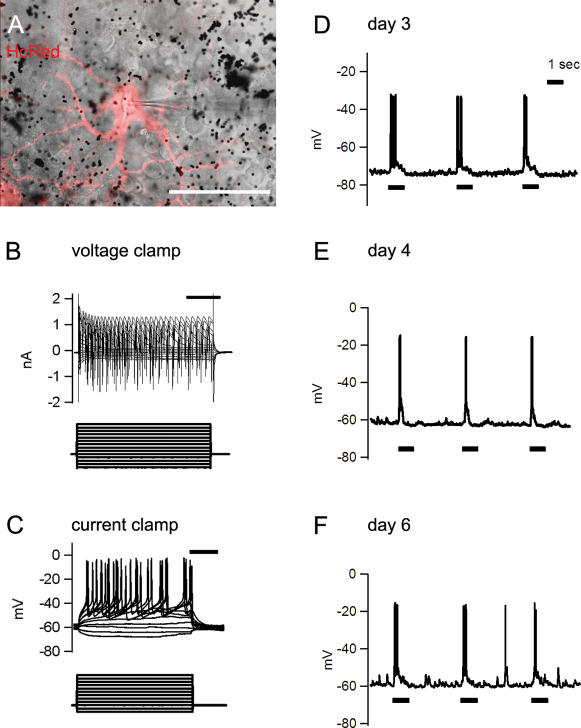
Figure 3. Patch-clamp recordings and light responses from ganglion cells in the incubated retina.
(A) HcRed-transfected ON-type retinal ganglion cells after 3 day incubation. The patch-clamp pipette is seen (its light responses shown in C). Black dots are unincorporated gold particles. Scale bar, 50 µm. (B) An example of voltage clamp and current clamp recordings after 6 day incubation. All of recorded ganglion cells (n = 30) generated action potentials in response to current injection under current clamp configuration. In the voltage clamp, the cells were voltage-clamped at −77 mV and then command pulses were applied from −117 mV to 13 mV, in 10 mV steps, for 200 msec. In the current clamp, command pulses were applied from −40 pA to +180 pA, in 20 pA steps, for 200 msec. Scale bars are 50 msec. (C–E) light responses of ganglion cells from 3 day (the cell shown in A), 4 day, and 6 day-incubated retina, respectively, recorded under current clamp.

