
Figure 1.
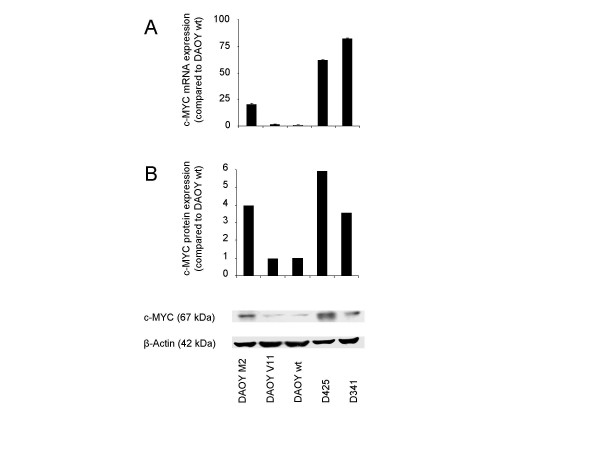
c-MYC mRNA (A) and protein (B) expression of the MB cell lines determined by quantitative RT-PCR and Western blot analysis. Values represent the fold-increase of c-MYC mRNA (n = 3; ± SD) and c-MYC protein expression (representative of two to three independent experiments) relative to the DAOY wt cells.