
Figure 2.
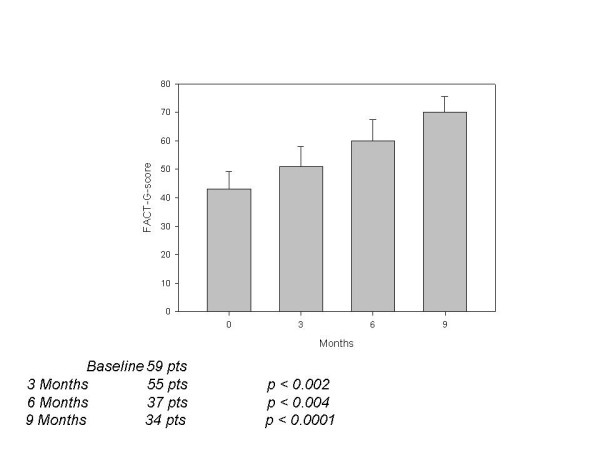
Variations (mean ± SD) in QoL in TMZ/WBRT treated pts. Statistical analysis has been performed by ANOVA comparing different time pts to the baseline values.
Official websites use .gov
A
.gov website belongs to an official
government organization in the United States.
Secure .gov websites use HTTPS
A lock (
) or https:// means you've safely
connected to the .gov website. Share sensitive
information only on official, secure websites.
Variations (mean ± SD) in QoL in TMZ/WBRT treated pts. Statistical analysis has been performed by ANOVA comparing different time pts to the baseline values.