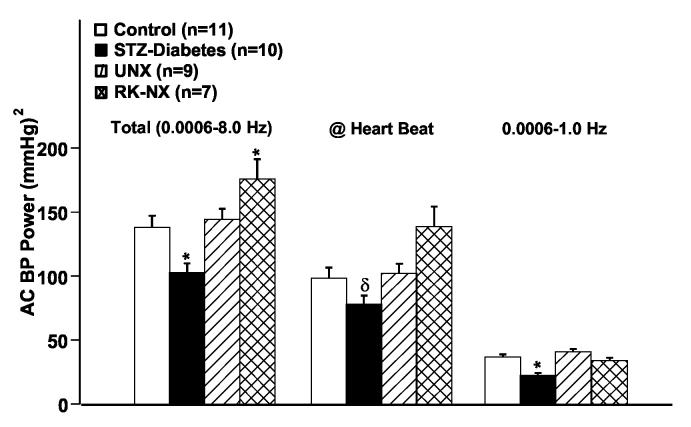
Fig. 4.
Quantitative data of the analysis of BP power spectra in control, partially insulin treated STZ-diabetes, UNX and RK-NX rats. The results for the total AC BP power, the AC BP power at heart beat frequency and at frequencies of 0.006-1 Hz are presented. See text for details. * p < 0.05 maximum compared to all other groups; δ p < 0.05 compared to the RK-NX group.

