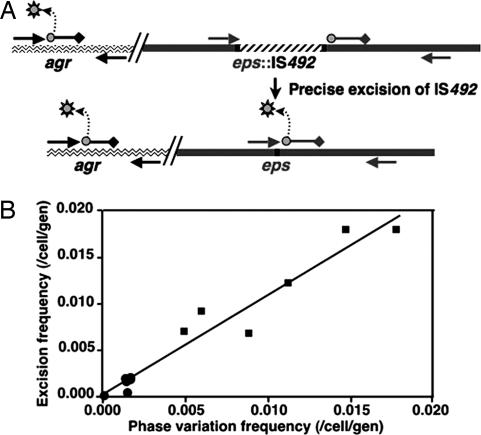
Fig. 2.
Correlation of IS492 precise excision from epsG, directly measured by qPCR, with pEPS phase variation in P. atlantica. (A) Two Taqman probes with different fluorophores (circles) and black hole quenchers (diamonds) are designed to separately measure amplification by the forward and reverse primers (arrows) of agrA (wavy line; base pairs 2849088–2850606) and restored epsG (dark gray line; base pairs 1303974–1304985). Release of the fluorophore (gray sun) from the probe by the 5′-3′ exonuclease activity of Taq polymerase fluorophore is measured (Bio-Rad iCycler Real Time PCR System). (B) The frequency of IS492 PEX mean values are plotted vs. the frequency of PPV mean values; the data are from six independent experiments.

