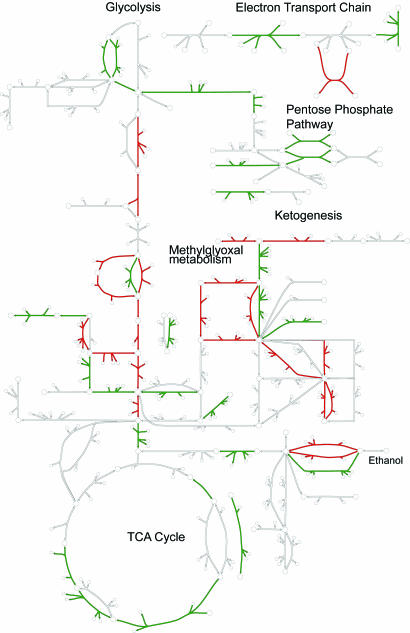
Fig. 4.
Integrated analysis of gene expression data from gastric bypass patients before surgery and 1 year afterward. Expression measurements were to reactions in the global human metabolic network and then visualized on Recon 1's comprehensive collection of human metabolic maps. Reactions are color-coded based on their corresponding gene expression changes (green, down-regulated; red, up-regulated; white, no data available or reaction level conflict). Arrows next to reaction abbreviations indicate the magnitude of expression changes on a log10 scale (gray boxes indicate no data available). A high-resolution version of this figure is available in SI Fig. 21.

