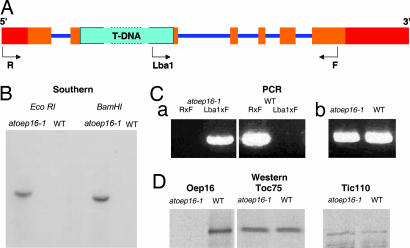
Fig. 1.
Description of the Atoep16-1 T-DNA insertion line (SALK_024018.50.90.X). (A) Diagram of the Atoep16-1:1 gene and respective T-DNA insertion. 5′ and 3′ untranslated regions are in red, exons are in ochre, and introns are in violet. The 4.5-kb T-DNA insertion (not drawn to scale) is shown in turquoise. R, F, and Lba1 mark primers used for PCR analyses. (B) DNA gel blot analysis of the Atoep16-1 line. Genomic DNA (10 μg) from homozygous Atoep16-1 or wild-type plants was digested with EcoRI and BamHI, respectively, and the filter-bound DNA fragments were hybridized to a DNA probe corresponding to the kanamycin-resistance gene of the T-DNA using standard procedures. (C) Confirmation of the T-DNA insertion by PCR using the following primers. (a) Lba1, 5′-ATGGTTCACGTAGTGGGCCATCG-3′; R (reverse primer), 5′-ATCCACCGTTAAAAGCCCCTT-3′; F, (forward primer), 5′-AACGAACTGAGAAGCGGTTGC-3′. (b) Primers specific for the adenine phosphoryl transferase gene of wild-type and Atoep16-1 plants. (D) Western blot analysis of OEP16 protein expression in chloroplasts of Atoep16-1 and wild-type plants. Protein was prepared from isolated chloroplasts and subjected to Western blotting using antisera against OEP16 and the 75- and 110-kDa proteins of the outer and inner envelope membrane translocases of chloroplasts TOC75 and TIC110, respectively.

