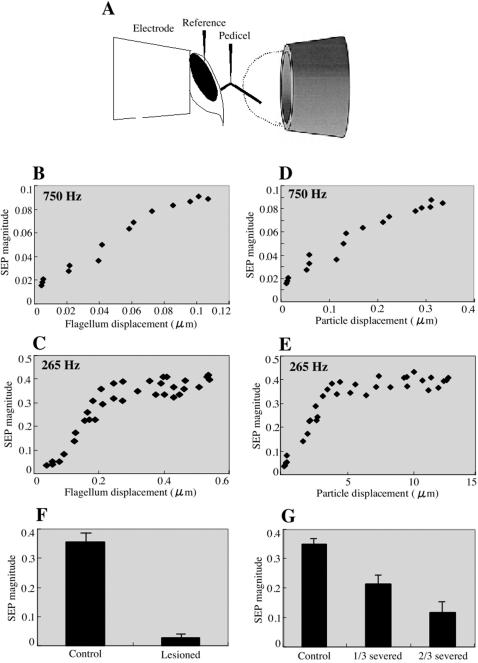
Figure 6.
Intensity characteristics of SEPs in response to acoustic stimuli. (A) Schematic representation of the preparation is shown. Honey bee heads are fixed and exposed from the end of a micropipette tip, and the recording electrode is inserted at the joint between the scape and pedicel (Fig. 1C) and the reference electrode penetrates the head cuticle. Sound stimuli are delivered through a Tygon tube ending in a 7 mm opening close to the honey bee. The dashed line indicates the hemispherical zone where full near-field acoustic conditions are maintained. The SEP magnitudes in response to 750 (B and D) and 265 (C and E) Hz tone stimuli are plotted against the flagellum (B and C) and air particle (D and E) displacements. The SEP magnitudes linearly increase with the flagellar tip displacement up to 100 nm. The response of JO neurons can be detected by 20 nm displacement of flagellar tip in response to 750 Hz stimuli. The background SEP magnitude is <0.02. The response of JO neurons saturates by the flagellar tip displacement above 200nm in response to 265 Hz stimuli. (F) Bar graph shows the mean SEP magnitudes in response to 265 Hz acoustic stimuli at 7 mm/s air particle velocity. SEPs were measured before (Control) and after (Lesioned) lesions in the pedicel. Error bars indicate standard error (N = 5 antennae per treatment, where the SEP of each antenna is the averaged response to 10 trials). (G) SEPs were measured before (Control) and after cutting off the distal one-third (1/3 severed) and two-thirds (2/3 severed) segment of the flagellum. Bar graph of the mean SEP magnitudes as above is shown. Error bars indicate standard error.

