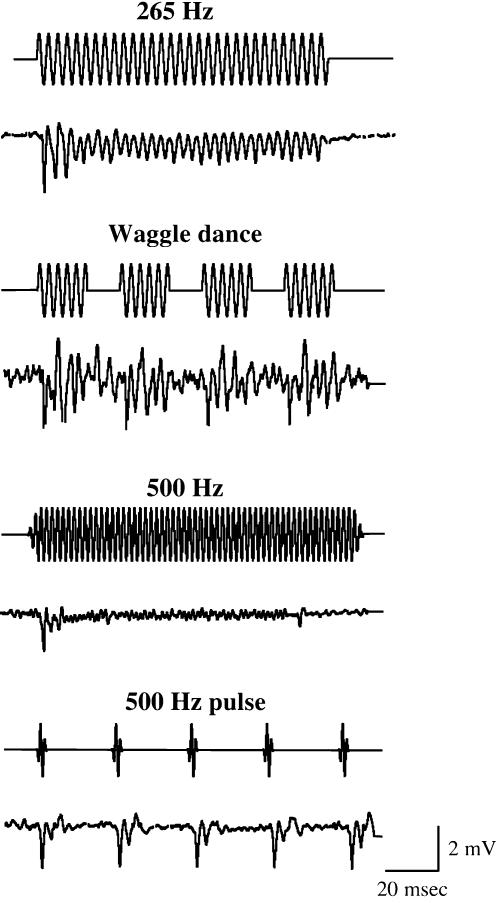
Figure 7.
Temporal patterns of honey bee SEPs in response to continuous and pulse tone stimuli. The time traces of honey bee SEPs in response to the continuous and pulse tone stimuli at 265 and 500 Hz frequencies are shown. The applied stimuli are the same as in Fig. 5. For each measurement, upper and lower traces indicate the time trace of sound stimulus and SEP, respectively. Each SEP shown is the averaged response of 10 trials in a single antenna. Both frequency and temporal patterns of SEPs are similar to those of the flagellar vibrations shown in Fig. 5.

