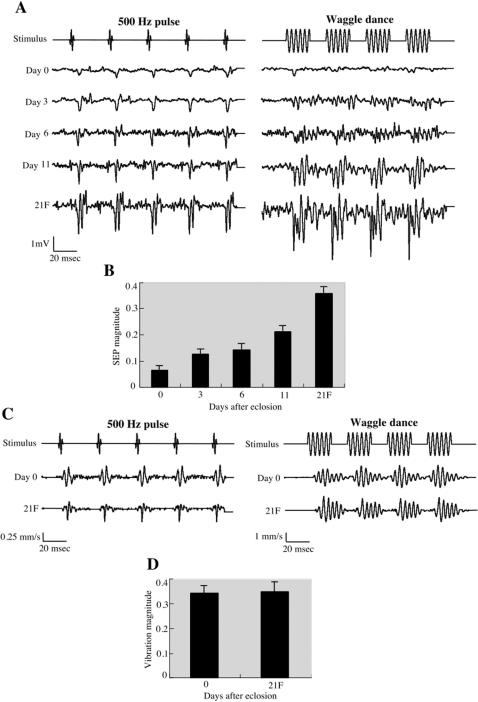
Figure 8.
The age-dependent response of honey bee JO neurons to acoustic stimuli. (A) Representative time traces of SEPs of 0, 3, 6, 11 and 21 day old bees (the 21 day old bees are foragers (21F)) in response to 500 Hz pulse and “waggle dance” sound stimuli are shown. Each SEP is the averaged response of 10 trials in a single antenna. Note the vertical scale is 1 mV. (B) Bar graph of 10-trial SEP magnitudes obtained with 265 Hz continuous sound stimuli at 7 mm/s air particle velocity for N = 5 antennae per treatment. Error bars indicate standard error. (C) The time traces of flagellar vibrations of 0 day old bees (Day 0) and 21 day old foragers (21F) in response to 500 Hz pulse and “waggle dance” sound stimuli are shown. Each vibration velocity shown is the averaged response of 10 trials in a single antenna. The vertical scales of the velocity to 500 Hz pulse and “waggle dance” sound stimuli are 0.25 and 1 mm/s, respectively. (D) Bar graph shows the mean vibration magnitudes in response to 265 Hz continuous sound stimuli at 7 mm/s air particle velocity. Error bars indicate standard error.

