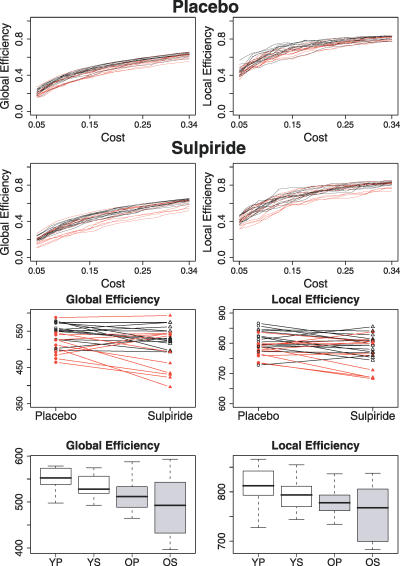
Figure 4. Efficiency Measures Estimated and Integrated over the Small-World Regime of Network Costs, 0.05 ≤ K ≤ 0.34.
(Rows 1,2) Global (left) and local (right) efficiency curves for young (black lines) and older (red lines) people after placebo (row 1) and sulpiride (row 2).
(Row 3) Within-subject effects of dopamine antagonism on integrated global efficiency (left) and integrated local efficiency (right): data on younger subjects are denoted by black lines and black triangles, data on older subjects by red lines and red triangles.
(Row 4) Box-plots showing median, interquartile range, and range for integrated global efficiency (left) and integrated local efficiency (right) in each age group after each treatment.

