
Figure 5.
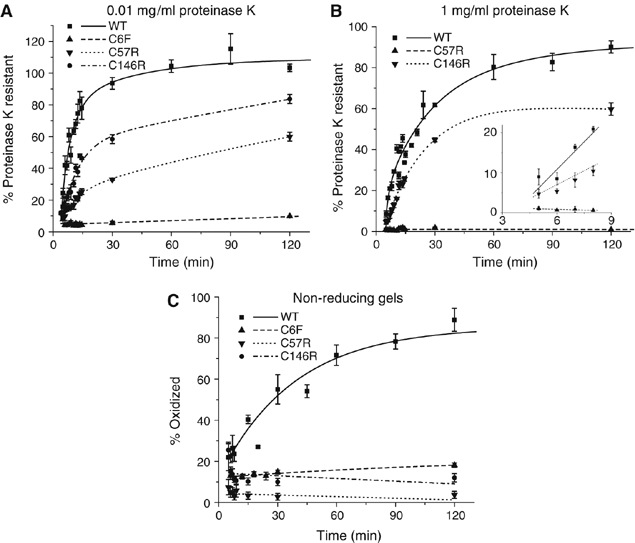
Effects of FALS-linked cysteine mutations on SOD1 folding. Kinetics of acquisition of resistance of FALS-linked Cys mutants to 0.01 mg/ml (A) and 1 mg/ml (B) proteinase K. Inset, initial rates of protease resistance for WT-SOD1 and mutants fitted to a linear least-squares regression model. (C) Kinetics of disulfide bond formation as described in Figure 2C. Graphical data are mean±s.e.m. from a minimum of three independent experiments per time point.