
Figure 6.
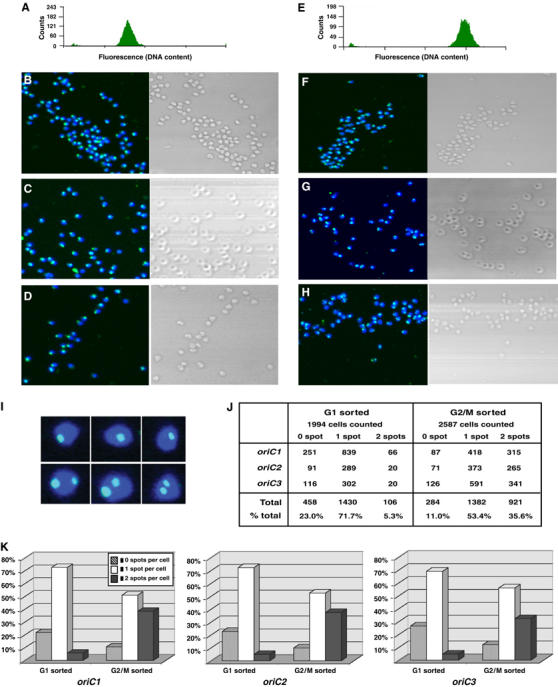
FISH staining of S. solfataricus origins of replication in G1 and G2/M sorted populations, demonstrating chromosome pairing at G2 phase. (A) Fluorescence histogram of the G1 (1C) sorted population. (B–D, F–H) Left-hand boxes exhibit confocal photomicrographs of FITC-labelled origins (oriC1, oriC2 and oriC3, respectively), counterstained with DAPI, in G1 (B–D) or G2/M (2C, panels F–H) sorted cells. Phase-contrast micrographs are displayed on the right-hand side of each panel. (E) FACS profile of the G2/M sorted population. (I) Enlarged images of single and double foci from oriC2-labelled cells. (J) Table summarising numbers of one, two and zero foci cells for each origin in both cell populations. (K) Histograms illustrating the FISH analysis data for each of the three origin-specific probes. In total, 1994 G1 sorted and 2587 G2/M sorted cells were counted, and scored into one of three categories, depending on whether an individual cell contained two, one or zero origin-specific spots. The histograms display the relative proportions of these three categories counted in the G1 or G2/M-sorted cells, for each of the three origins of replication. The individual cell counts are summarised in the table.