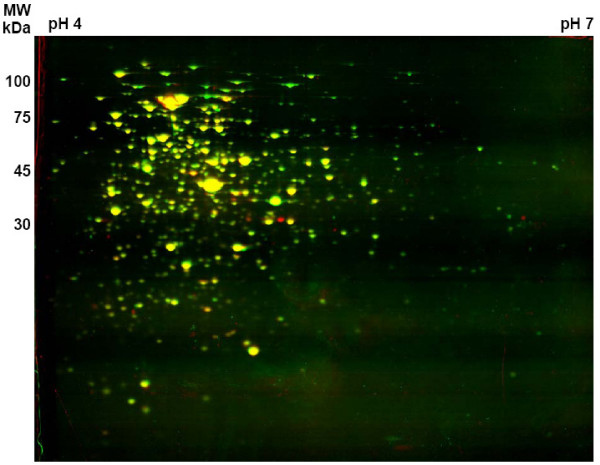
Figure 3.

Comparison of cytoplasmic proteins of wild type strain ATCC 13032 and strain ΔftsH. Overlay of 2-D gels and false colour presentation: wild type proteins were stained in green, proteins of the deletion mutant in red. Spots present in both protein profiles appear in yellow. Molecular mass and pH range are indicated.
