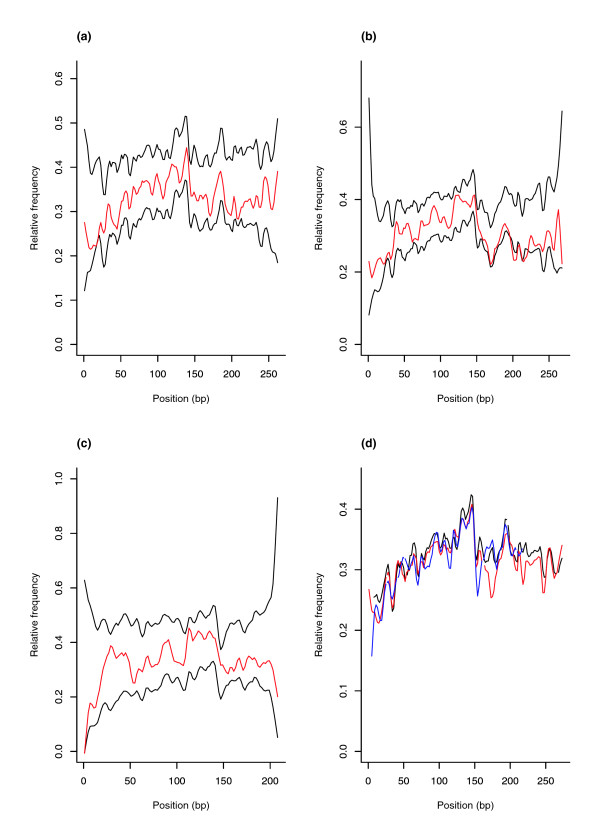
Figure 3.

Co-conservation profile of MIR sequences. Co-conservation frequency at each position of (a) MIR (n = 277), (b) MIRb (n = 382) and (c) MIR3 (n = 104) consensus sequences in immune response gene introns (red lines). Frequency intervals corresponding to the 1st and 99th percentiles in 100 random sample frequency distributions are represented by the black lines. (d) Co-conservation profiles of MIR sequences located in human introns; in this case, positions correspond to the alignment of the three MIR subtypes: MIR (black), MIRb (red) and MIR3 (blue).
