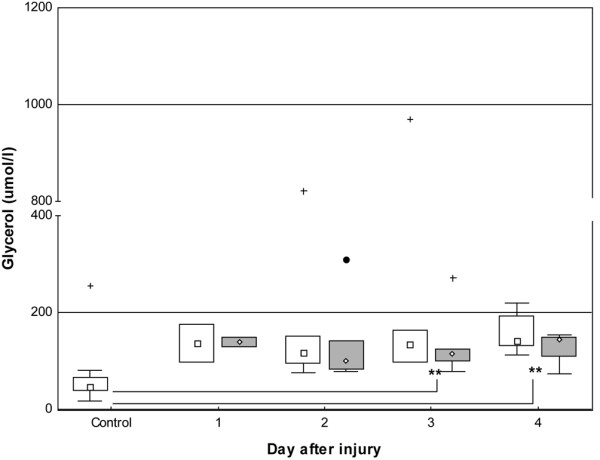
Figure 5.

Box-and-whisker plots showing median (interquartile) concentrations of glycerol in microdialysate from days one to four. Open boxes indicate uninjured skin and controls; shaded boxes indicate burned skin. Controls, n = 9. Uninjured skin on day 1, n = 2; day 2, n = 5; day 3, n = 6; and day 4, n = 5. Burned skin on day 1, n = 2; day 2, n = 5; day 3, n = 6; and day 4, n = 4. **P < 0.01. Filled circle and plus signs indicate outlier and extremes, respectively.
