
Figure 1.
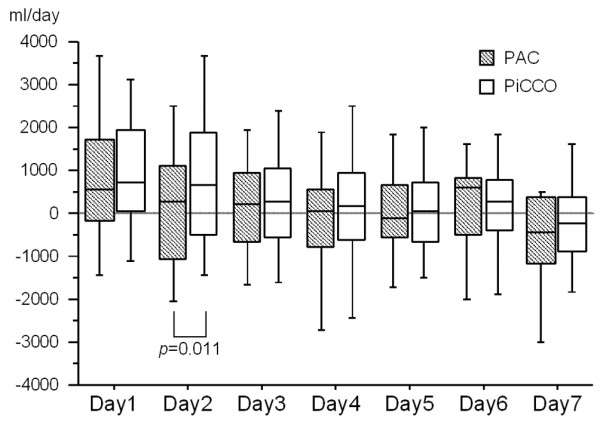
Box plot diagram illustrating daily fluid balance during seven days of invasive monitoring. During day two, fluid balance was more positive in PiCCO-monitored patients compared with PAC-monitored patients (p = 0.011). PAC, pulmonary artery catheter; PiCCO, pulse contour cardiac output.