
Figure 1.
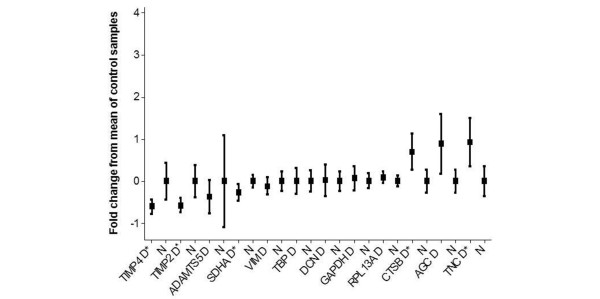
Graph illustrating the means and 95% confidence intervals (CIs) of the gene expression profiles. To normalise values, the mean of each control group has been used to normalise and produce fold changes in expression. The results of the COL9A3 transcript are omitted because the 95% CIs were very high. *Significant difference. ADAMTS5, ADAM metallopeptidase with thrombospondin type 1 motif, 5; AGC, aggrecan; COL9A3, type IX collagen alpha 3 chain; CTSB, cathepsin B; D, disease; DCN, decorin; GAPDH, glyceraldehyde-3-phosphate dehydrogenase; N, normal; RPL13A, ribosomal protein L13a; SDHA, succinate dehydrogenase complex, subunit A; TBP, TATA box binding protein; TIMP2, tissue inhibitor of metalloproteinase 2; TIMP4, tissue inhibitor of metalloproteinase 4; TNC, Tenascin C; VIM, vimentin.