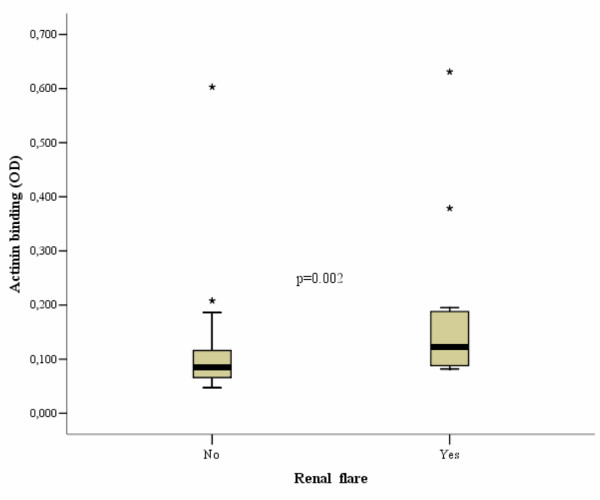
Figure 2.

Box plot of the optical density (OD) of α-actinin binding in patients from pre-selected systemic lupus erythematosus group with and without renal flares. Thick bars indicate median values, and boxes border the interquartile range. Asterisks represent outliers.
