
Figure 3.
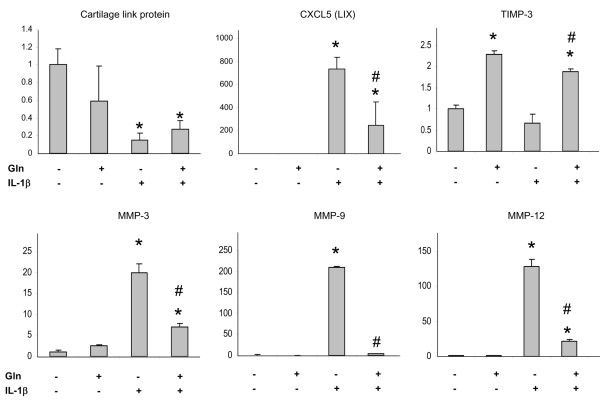
Real-time PCR analyses of cDNA generated from chondrocytes treated with glucosamine (Gln) and IL-1β. Data presented as the mean + standard error of the mean (n = 3). *P < 0.05 versus untreated, #P < 0.05 versus IL-1β alone.
Official websites use .gov
A
.gov website belongs to an official
government organization in the United States.
Secure .gov websites use HTTPS
A lock (
) or https:// means you've safely
connected to the .gov website. Share sensitive
information only on official, secure websites.
Real-time PCR analyses of cDNA generated from chondrocytes treated with glucosamine (Gln) and IL-1β. Data presented as the mean + standard error of the mean (n = 3). *P < 0.05 versus untreated, #P < 0.05 versus IL-1β alone.