
Figure 7.
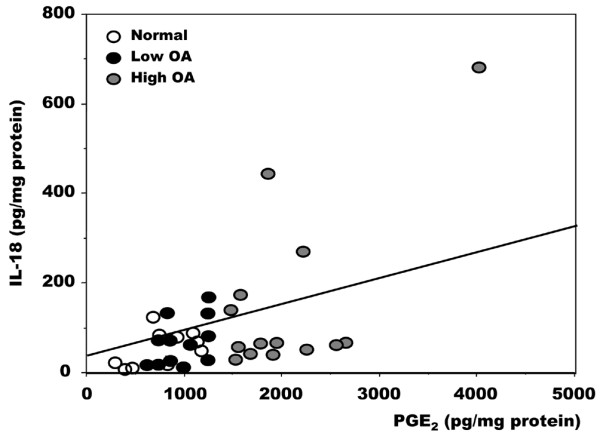
Relationship between PGE2 and IL-18 levels in normal and osteoarthritis osteoblasts. Confluent cells were incubated for their last 48 hours in serum-free medium containing 1% insulin-transferrin-selenium mix (ITS). Prostaglandin E2 (PGE2) and IL-18 levels were measured in supernatants with the use of selective ELISA. Data are values for individual cell cultures. Osteoarthritis (OA) osteoblasts were separated into low and high OA as described in the legend to Figure 1. Normal samples, n = 10; low OA, n = 12; high OA, n = 14 samples.