
Figure 1.
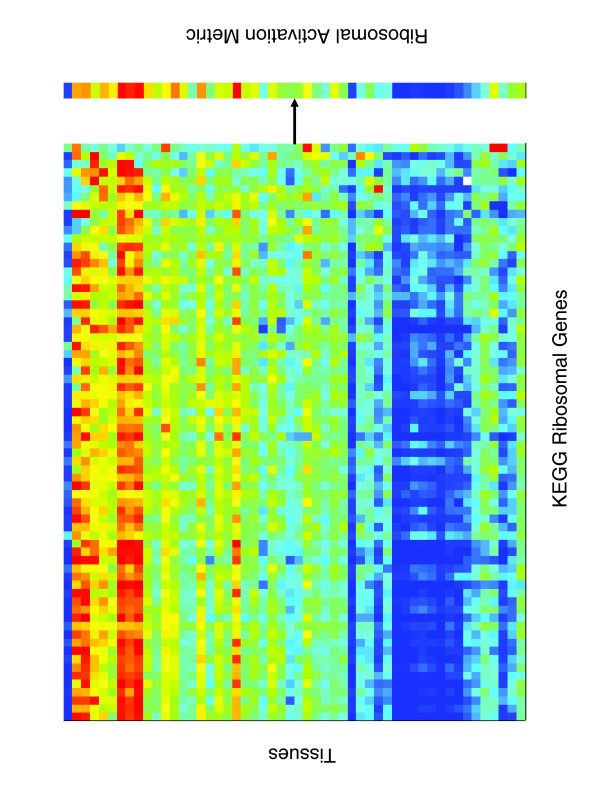
Example of pathway activation calculation. Shown on the left are the expression levels of the 70 genes in the KEGG Ribosome gene set measured across a set of tissue samples. The columns are genes and the rows are tissues. Bright red indicates overexpression of a gene relative to a pool of all tissues, and dark blue significant underexpression. For each tissue, the pathway activation metric (represented by the black arrow) is used to calculate a corresponding scalar value that captures the predominant expression of the genes in the Ribosome gene set in that tissue. Taken together, these scalar values constitute the pathway activation metric vector shown on the right.