
Figure 3.
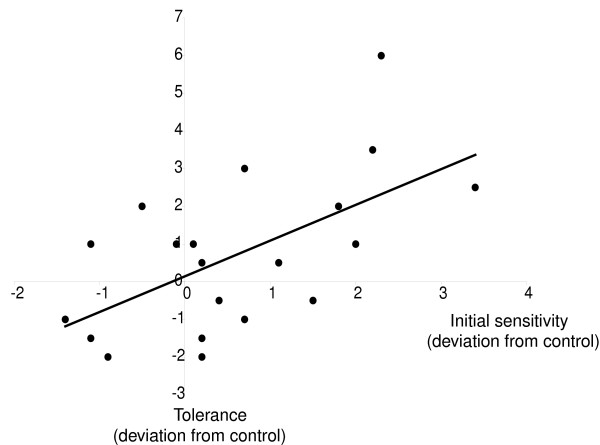
Correlation between initial sensitivity to the inebriating effects of ethanol and the subsequent development of tolerance for 20 P-element mutant lines. All values are expressed as deviations from the co-isogenic control line.
Official websites use .gov
A
.gov website belongs to an official
government organization in the United States.
Secure .gov websites use HTTPS
A lock (
) or https:// means you've safely
connected to the .gov website. Share sensitive
information only on official, secure websites.
Correlation between initial sensitivity to the inebriating effects of ethanol and the subsequent development of tolerance for 20 P-element mutant lines. All values are expressed as deviations from the co-isogenic control line.