
Figure 1.
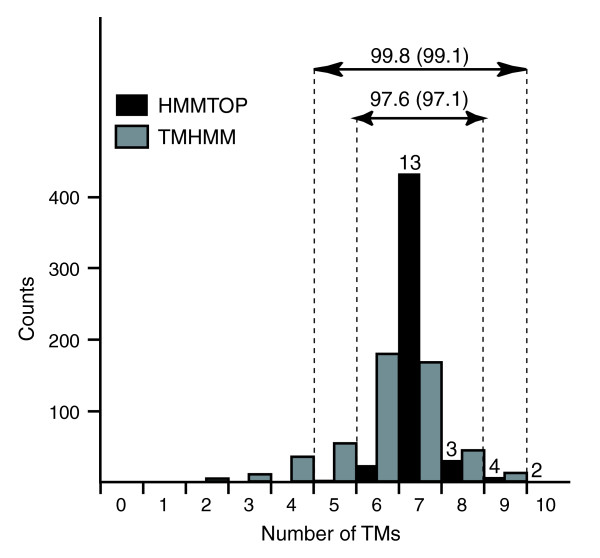
Distribution of transmembrane numbers predicted by HMMTOP (black bars) and TMHMM (gray bars) from the 500 7TMR sample sequences. Proportions (%) of the proteins predicted to have six to eight and five to nine TM regions by HMMTOP are shown at the top. The percentages shown in parentheses were obtained from the entire 7,674 7TMR dataset in GPCRDB. The numbers shown on the top of black bars are the number of previously predicted 22 Arabidopsis 7TMpR proteins.