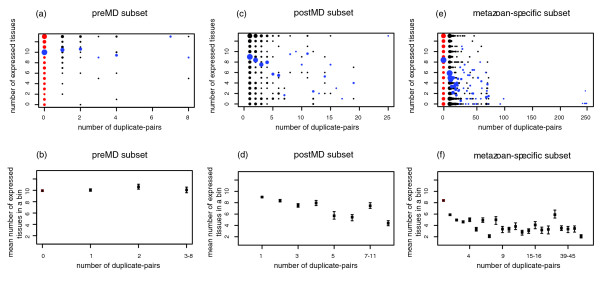
Figure 3.

Expression breadth versus the number of duplicate pairs in the preMD, postMD and metazoan-specific subsets. Red dots indicate singleton proteins, and black dots indicate duplicate proteins. The tissues tested are the 13 cluster-representing tissues. (a,c,e) The size of the dots represents the number of proteins that have the same number of duplicate pairs and the same expression breadth. The blue dots represent the average expression breadth of proteins with the same number of duplicate pairs. preMD subset (panel a): sample size = 291 proteins, Kendall's tau = 0.001, P = 0.51, 95% confidence interval = -0.10 to +0.10); postMD subset (panel c): sample size = 431 proteins, Kendall's tau = -0.15, P = 1.2 × 10⁻⁶, 95% confidence interval = -0.23 to -0.08; metazoan-specific proteins subset (panel e): sample size = 1060 proteins, Kendall's tau = -0.28, P = 9.7 × 10-43, 95% confidence interval = -0.33 to -0.24. (b,d,f) Proteins are ordered according to their number of duplicate pairs and collected into bins of at least 10 proteins. Each point represents a bin. Error bars indicate the standard deviation from the mean, obtained by bootstrapping. postMD, post-multicellularity duplicates; preMD, pre-multicellularity duplicates.
