
Figure 6.
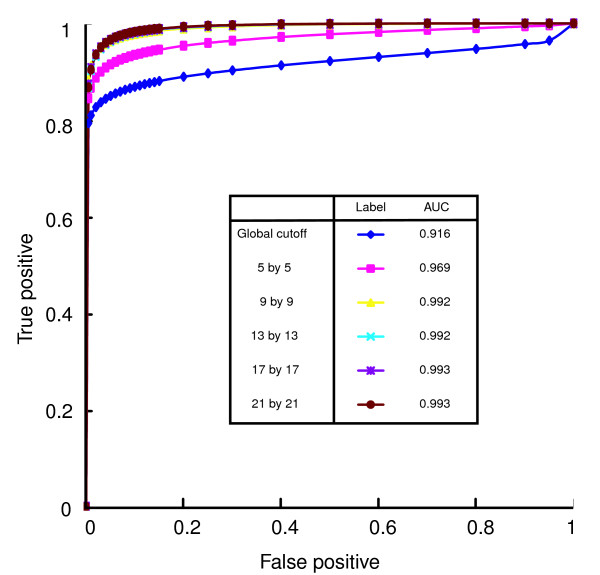
ROC curve comparing the global cutoffs and local cutoffs in calling positive spots. The test slide has six unique positive controls (Sla2p and Myo4p in three different titrations). The performance of identifying the positive controls is increased by using local cutoffs generated in relatively large surrounding windows. Five window sizes were tested and the best performance was achieved using nine by nine or larger windows.