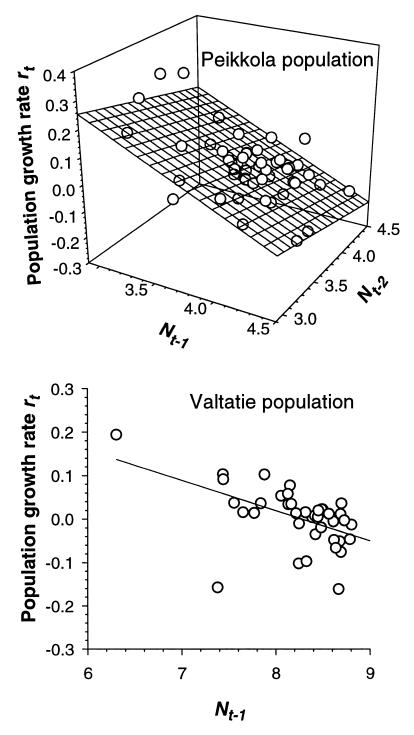
Figure 4.
Density dependence in Phytobia populations. Phase plots of per capita rate of increase, rt = ln (Nt/Nt−1), of Phytobia populations at Peikkola and Valtatie plotted against lagged population densities (Nt−1 and Nt−2) after detrending the time series with the general linear model described in Table 1 and Fig. 2. The best linear response surface models (Table 1) were a second-order time series model (rt = 1.076–0.198 Nt−1 − 0.086 Nt−2, r2 = 0.45) for Peikkola population, and a first-order time series model (rt = 0.576–0.069 Nt−1, r2 = 0.25) for Valtatie population.

