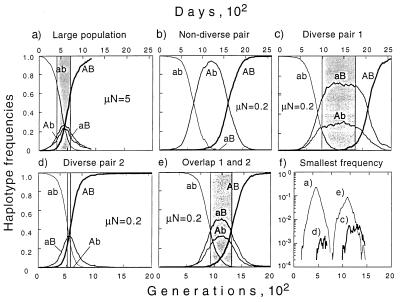
Figure 4.
Computer simulation of the reversion at two sites in the selection–drift regime (1/s ≪ N ≪ 1/μ). The four curves in a–e are frequencies of four haplotypes. A and B denote the first and second site, A and a denote wild type and mutant. The selection coefficient, s, is equal for the two sites. Parameter values: all panels are obtained at s = 0.1, N = 5,000, and rescaled along the time axis to correspond to s = 0.01. The mutation rate μ = 10−3 in panel a and 4⋅10−5 in b–f. Runs like that in panel b are the most frequent, pattern c is less frequent, and patterns d and e are least frequent. Gray shading shows the time interval in which both sites of a pair have mutant frequency in the interval 25–75%. Panel f shows the time dependence of the smallest haplotype frequency for the four runs a and c–e.

