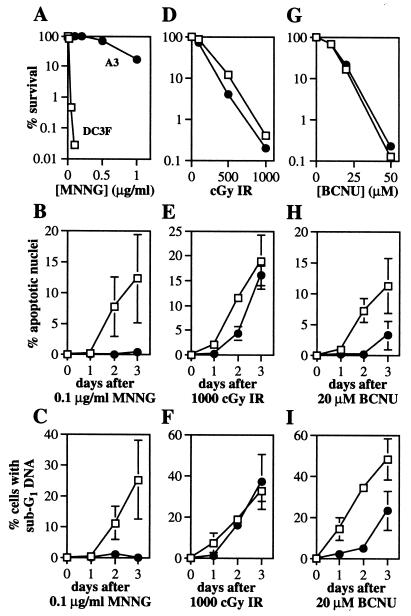
Figure 2.
Cell survival (A, D, and G) and apoptosis (B, C, E, F, H, and I) after treatment of DC3F (□) and A3 (●) cells with MNNG (A, B, and C), IR (D, E, and F) and BCNU (G, H, and I). Representative survival curves are shown. Apoptosis was measured by nuclear morphology (B, E, and H) and fluorescence-activated cell sorting analysis (C, F, and I). Each point represents the mean ± SD of at least two independent determinations. Note the different y-axis scales.

