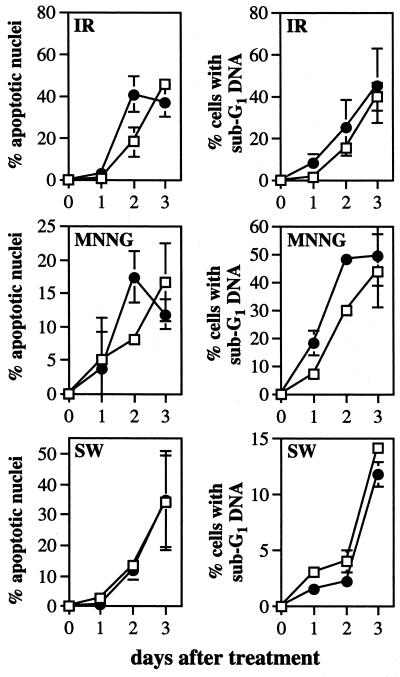
Figure 6.
Apoptosis in TK6-E6 (□) and TK6-E6C (●) cells after 200 cGy of IR (Top), 0.02 μg/ml MNNG (Middle), and serum withdrawal (Bottom), as described in Fig. 2. Apoptosis was quantitated by nuclear morphology (Left) and cell sorting analysis (Right).

