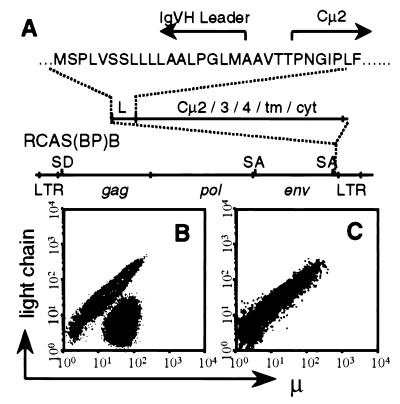
Figure 1.
μ+L− cells in the bursa of RCAS-Tμ-infected neonatal chicks. (A) Schematic representation of the RCAS-Tμ construct. SD and SA indicate splice donor and splice acceptor sites, respectively. (B and C) Contour plots of 10,000 bursal cells from neonatal chicks infected as day 3 embryos with RCAS-Tμ (B) or RCAS(BP)B (C) stained for μ and L expression.

