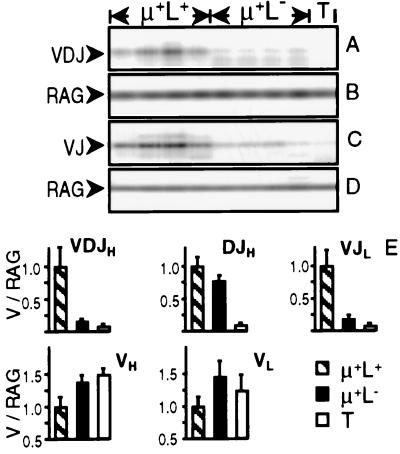
Figure 3.
V gene rearrangements in μ+L− cells from the bursa of neonatal RCAS-Tμ-infected chicks. (A–D) Genomic DNA was PCR-amplified from 1,500 FACS-sorted μ+L+ and μ+L− bursal cells from four individual RCAS-Tμ-infected neonatal chicks and from thymocytes (T) for the presence of VDJH (A) or VJL (C) rearrangements. The same samples were coamplified with RAG2 primers B and D, respectively. (E) Genomic DNA was PCR-amplified from sorted μ+L+ and μ+L− bursal cells and thymocytes from four individual RCAS-Tμ-infected chicks for VDJH, DJH, and VJL rearrangements and for germ-line VH1 and VL1 loci. RAG2 sequences were coamplified with all samples. Ig signal intensity was normalized to RAG2 signal intensity for each sample. The normalized Ig signal intensity was set arbitrarily to 1.0 for the μ+L+ bursal cell population, and the μ+L− and thymocyte populations were calculated relatively, with each bar showing the mean ± SD of four individual samples.

