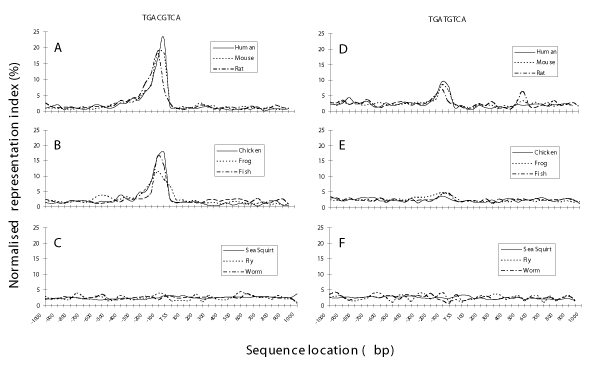
Figure 2.

Variation of representation index (RI) over the TSS-SR of 9 species. The normalised representation index of each 50 bp window along the TSS-SRs are plotted for the canonical (TGACGTCA) and TG-variant (TGATGTCA) CREs in mouse, rat and dog (A and D); chicken, frog and fish (B and E); and sea squirt, fly and worm (C and F), respectively. In order to be comparable on the same scale, we normalised the RI values in each 50 bp by dividing them by the sum of all RI values in the 40 windows over the TSS-SRs. The values presented are percentages.
