
Figure 4.
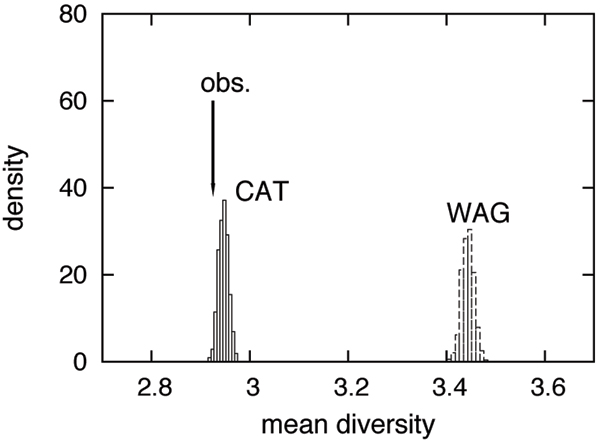
Posterior predictive analysis of the mean number of distinct residues observed at each column of the alignement (mean diversity). The analysis was done on Meta1, using the nematode/fungi taxon configuration.
Official websites use .gov
A
.gov website belongs to an official
government organization in the United States.
Secure .gov websites use HTTPS
A lock (
) or https:// means you've safely
connected to the .gov website. Share sensitive
information only on official, secure websites.
Posterior predictive analysis of the mean number of distinct residues observed at each column of the alignement (mean diversity). The analysis was done on Meta1, using the nematode/fungi taxon configuration.